The NVisionAg Process

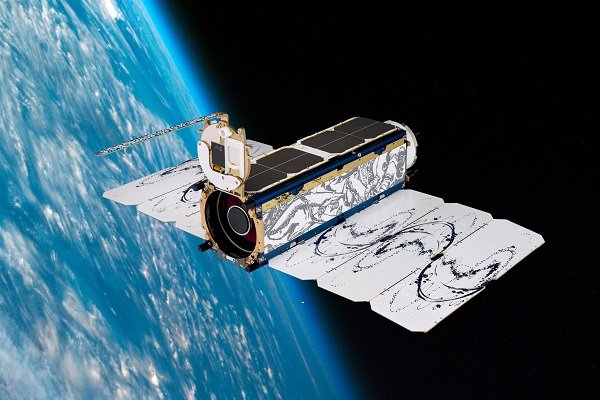
1. Acquire Satellite Image
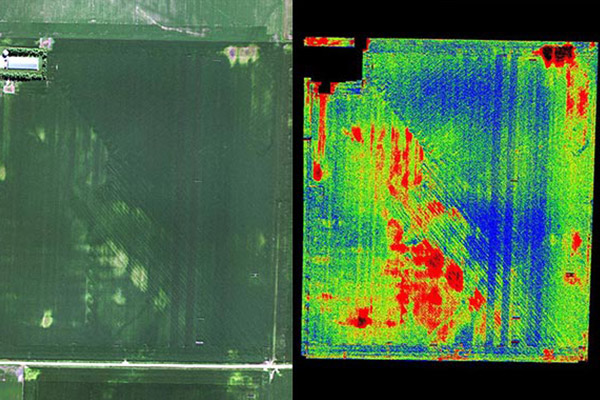
If you look at it and don’t see a problem, you’re done. If you see potential issues, you can order the yield loss map.

2. Yield Loss Map
Shows you how much you’re losing, and where. Gives you total yield loss and dollar loss for the field. Based on patented university research. If you’re not losing much yield, you’re done. If you are, and you have the ability to variable-rate nitrogen over tall corn, you can order the Nitrogen rate control file.

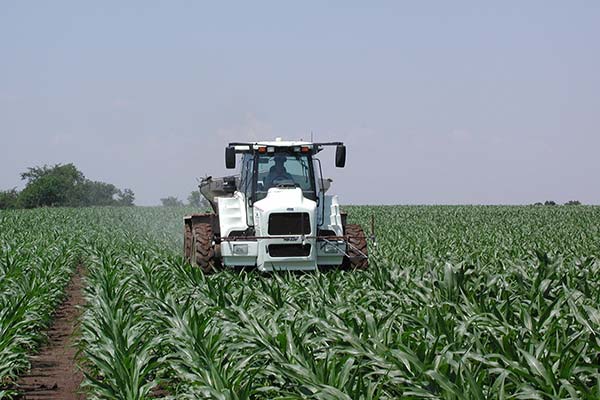
3. Nitrogen Rate Control File
Puts the N where your corn needs it to turn yellow back to green. Leaves green enough alone.
